The Analytics tab helps you track how well your event or campaign is performing.
Instead of guessing, you can clearly see numbers and results like how many people interacted, opened messages, clicked links, or made purchases. Think of Analytics as your campaign report card.
It is located at the top menu where you’ll see analytics features. When you click Analytics, Adflipr shows you performance data for the selected event and time period.
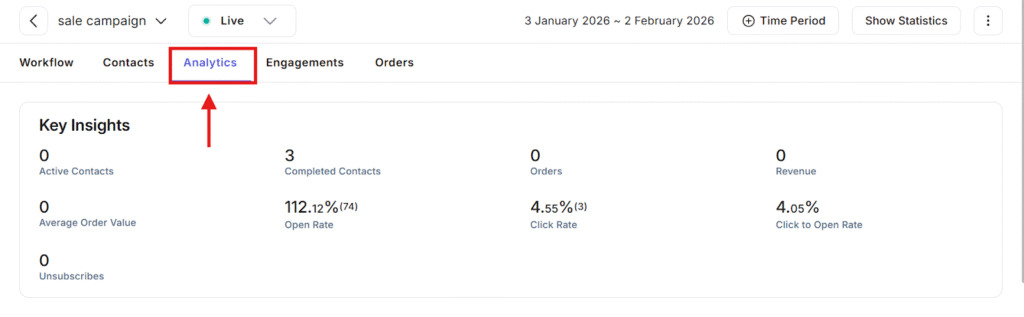
Key Insights Section
It gives you a quick overview of how your event is doing.
1. Active Contacts
- Shows how many people are currently active in the workflow
- If this is 0, it means no contacts are running through the event right now or it will show the number of active contacts.
It is Useful to know if your campaign is still live or finished.
2. Completed Contacts
- This shows how many contacts finished the entire workflow
- These users went through all steps successfully
It helps you understand how many people fully experienced your event.
3. Orders
- Displays how many purchases were made
- If it’s 0, it means no orders were completed during this. It is important for tracking sales performance.
4. Revenue
- Shows total money earned from orders
- Since there are no orders, revenue is also 0
This directly shows your campaign’s financial result.
5. Average Order Value
- This is the average amount spent per order
- Since there are no orders, it stays at 0 either if the order value is placed the number will show up.
It helps you understand customer spending behavior.
6. Open Rate
- Tells you how many times your messages were opened
- The number in brackets means total open rate.
- A rate above 100% usually means some people opened the message more than once.
It shows how interesting or engaging your message subject is.
7. Click Rate
- Shows how many people clicked links inside your message.
- Number beside click rate means total clicks
Indicates how effective your message content and call-to-action are.
8. Click to Open Rate
- This measures how many people clicked after opening
- It focuses only on users who already opened the message.
It helps judge content quality, not just subject lines.
9. Unsubscribes
- Shows how many people unsubscribed
- The number beside unsubscribes means no one opted out.
It helps to indicate your content is not annoying or spammy.
The Analytics feature helps you:
- Understand audience behavior
- Measure engagement and interest
- Track sales and revenue
- Improve future campaigns
- Make data-based decisions instead of guessing
Performance section
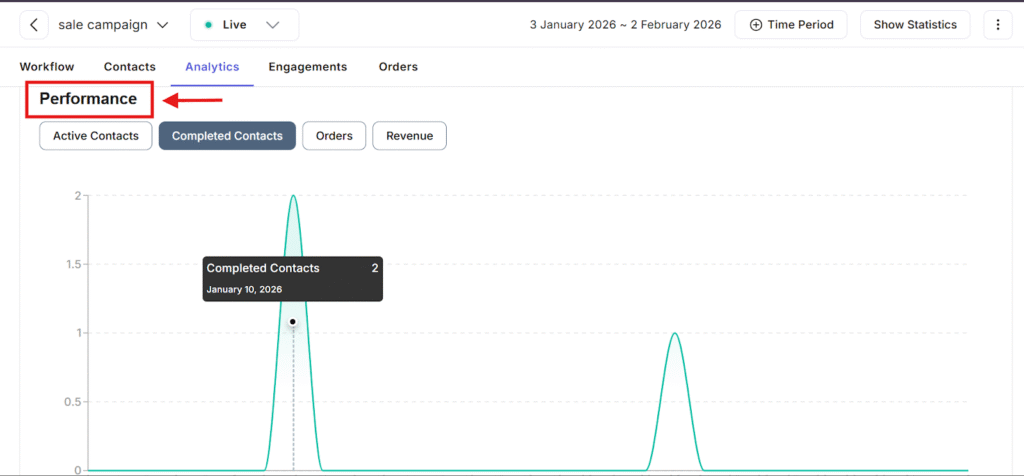
The Performance section shows you how your event is performing over time using visual graphs. Instead of just numbers this section helps you see trends when activity increased, when it dropped, and how users interacted during your selected time period. This feature confirms you are viewing performance based analytics, not just summaries.
Below the Performance title, you see four buttons which describes:
1. Active Contacts
- Shows how many contacts were actively moving through the workflow
- Useful to see ongoing engagement
2. Completed Contacts
- Shows how many contacts completed the entire workflow
- The graph displays completion activity across the selected dates.
- This helps you know when users finished your event steps.
3. Orders
- Displays how many orders were placed over time
- Useful for tracking sales performance
4. Revenue
- Shows revenue generated over time
- Helps track earning trends visually
Each button updates the graph instantly when selected.
The line graph shows activity over time:
- Horizontal axis (X-axis) → Time / Dates
- Vertical axis (Y-axis) → Number of actions (contacts, orders, or revenue)
This section helps you:
1.Understand when users are most active
2.Identify high-performing days
3.Track progress visually instead of reading raw numbers
4.Improve future campaigns by learning what timing works best
5.Compare contacts, orders, and revenue in one place.
The visual graphs make it simple to track progress over time, and see what’s working and what needs improvement. While analytics helps you make informed decisions by showing exactly how your audience interacts with your messages and offers, these features turn data into clear insight helping to run your campaigns more successfully.